Meanwhile, the UK – with about 1.7GW currently – will reach about 4GW, and looks set to slip in the rankings in terms of absolute datacentre capacity and in terms of megawatts (MW) to gross domestic product (GDP).
That’s according to figures from commercial property agent Cushman & Wakefield, plus GDP data from the International Monetary Fund (IMF), with analysis by Computer Weekly.
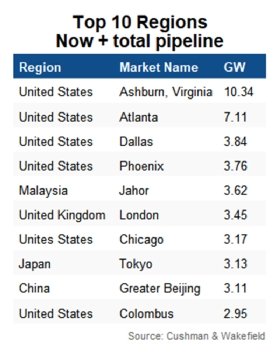
Also in the US, Virginia is set to retain its nickname of “datacentre alley”, with capacity in the pipeline that will see it retain its number one region ranking and take it to more than 10GW. London, however, could move up the rankings here to become the sixth largest datacentre region if all planned capacity is built.
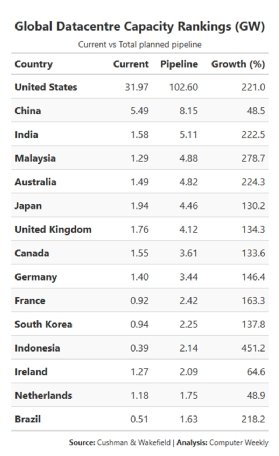
The UK currently ranks fourth in megawatt capacity terms – behind the US, China and Japan – with about 1.76GW of capacity. But it will slip to seventh in terms of total operational and planned capacity, with India, Malaysia and Australia set to leapfrog it.
The UK ranks eighth currently in terms of MW to GDP, but will slip to 10th if we measure all current and planned capacity.
In terms of datacentre regional capacity, London ranks eighth with 1.53GW. It stays at eighth if projects under construction are taken into account (rising to 1.82GW), but jumps to sixth if the total pipeline is considered (3.25GW), although that may include projects that have not gained planning consent and may never do so.
It’s possible that “London” takes into account much more than that region in Cushman & Wakefield’s figures, however. Computer Weekly research (see box: Nailing down datacentre pipeline numbers) into installed datacentre capacity has the whole of the UK at about 1.6GW, including the M62 region plus the North East and Scotland.
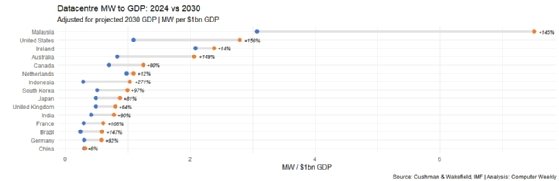
Ireland currently lies 10th in terms of installed capacity, with 1.27GW. It slides to 13th in terms of total under construction and pipeline, at around 2GW. But in terms of MW to GDP, it sits second, only dropping to third when we measure currently installed and all pipeline against the projected 2030 GDP.
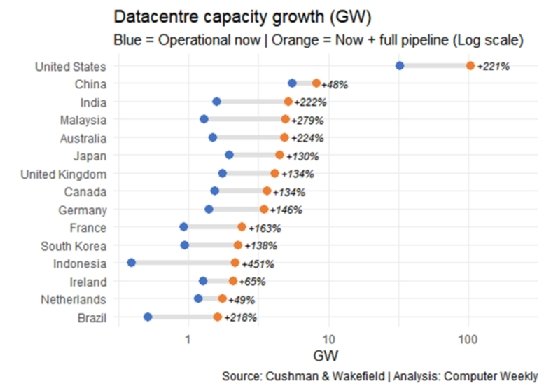
While the US looks determined to maintain its position in the world datacentre rankings – it has a projected capacity growth rate of 221% – it is outstripped in growth terms by some countries that look keen to expand datacentre capacity.
The shooting star among these is Indonesia, with projected growth of 451% in capacity terms (to 2.1GW). Behind it is Malaysia at 279% projected growth (to 4.87GW).
They appear to be aiming at becoming providers of datacentre capacity for regional economies such as Singapore, Thailand and Vietnam.
Singapore had been the dominant regional hub, but power and land constraints saw it call a halt to further datacentre development. This has been somewhat reversed, but Indonesia and Malaysia have seen an opportunity to make use of their resources, with Amazon, Google, Microsoft and Meta pledging billions of dollars towards datacentre projects there.
Meanwhile, the Cushman & Wakefield numbers show growth in datacentre capacity of 200% or more for Australia, India and Brazil.
Australia benefits from vast amounts of land and renewable energy, allied with some of the world’s strictest data sovereignty laws. The latter has forced huge local builds that wouldn’t exist if the data could be hosted in cheaper regional hubs. It is set for datacentre capacity growth of 224% (to 4.8MW) and MW to GDP growth of 149%.
India’s sizeable growth – 222% in capacity (to 5.1MW) and 90% growth in MW to GDP – is driven by regulatory mandates, a gargantuan domestic user base and structural cost advantages. India has implemented some of the world’s most stringent data residency requirements. Also, global companies that previously served India from hubs in Singapore or Dubai are now legally required to build or lease physical capacity inside India.
Brazil benefits from being a key economic centre for South America, is a primary landing point for subsea cables on the continent, has lots of renewable energy and – this is becoming a theme – has strict data sovereignty requirements. It has a projected capacity growth rate of 218% (to 1.6GW) with a MW to GDP growth of 147%.
Here, similarly to India, Brazilian law encourages companies to store the data of Brazilian citizens on-shore, which has forced cloud providers to expand local regions in São Paulo and Rio de Janeiro.
In Europe, meanwhile, the UK, France and Germany are hitting structural limits in terms of power supply, with waits measured in years to get a grid connection. At the same time, there is a scarcity of land and strict sustainability requirements.
Having said that, these are mature markets, and where there are constraints in terms of new construction in established centres, that is now moving towards other areas in nearby countries such as Italy, Spain and Poland, or within countries, such as the shift north in the UK.
Ireland, specifically Dublin, built out its capacity years before the rest of Europe, but was the first major global hub to hit a “grid ceiling”. Current capacity is 1.2GW. Since 2021, state-owned grid operator EirGrid has implemented a functional moratorium on new datacentre connections in the greater Dublin area. By 2024, datacentres consumed 21% of Ireland’s total electricity – more than all its homes combined.
Now, under new regulations, if a company wants to build a new datacentre of more than 10MW, they must provide their own on-site generation – like gas turbines or battery arrays – to back up 100% of their demand.
Meanwhile, Ireland is the European headquarters for virtually every major US tech firm, and because they book profits in Ireland, GDP is roughly 40% higher than the actual value produced by the Irish population. So, its MW to GDP growth rate in these figures is 5.7%.
For that reason, Ireland’s GDP is considered unreliable for measuring actual domestic economic health.
If we measure a country’s datacentre capacity in megawatts (MW) against its gross domestic product (GDP), we get some idea of whether that capacity is primarily a utility supporting its own domestic economy or effectively an export designed to process data for the rest of the world.
By looking at how that will change, we can also see the trajectory of that country relative to its digital economy.
The ratio of MW to GDP is a measure of digital infrastructure compared to the economy more broadly. In the datacentre age, it’s like measuring “miles of track per capita” or “steel production per GDP” as measures of industrial development.
We can see from the numbers that differing models emerge.
Very high ratios of MW capacity to GDP – for example, Ireland, Indonesia, Malaysia – suggest a country positioned as a “digital exporter”. They consume power domestically to process data for other countries. Their MW capacity is high, while GDP is low.
Meanwhile, very low ratios of MW capacity to GDP – for example, Japan, the UK, the Netherlands – will often be mature, service- or manufacturing-heavy economies where datacentres support domestic business rather than act as an export.
Most of the world’s developed economies fall into the latter category, while some rapid movers from a less-developed starting point fall into the former.
Two countries, however, seem set for rapid but balanced growth – the US and Australia. They’re both countries with vast space and scope for renewable energy, and they have developed economies. With projected MW to GDP growth of 150% or more, that could indicate a sweet spot in terms of economic development.
We must treat a lot of the numbers around datacentre development with some dosage of salt. Computer Weekly recently ran analyses of installed and pipeline capacity for the UK. In some cases, those figures accord with Cushman & Wakefield’s research.
For currently installed UK capacity, Computer Weekly calculated 1.6GW using data gained from Electricity Performance Certificate registers. Cushman & Wakefield posts a total 1.7GW.
When it comes to pipeline, Computer Weekly took data from construction tracking analyst Barbour ABI that lists all projects currently in planning, some of which have gained consent, while others have not. Within this data, some megawatt capacity numbers had to be estimated because planning documents don’t mandate recording of proposed datacentre capacity.
Computer Weekly calculations for the UK pipeline total around 8GW, with 5.9GW having planning consent or being under construction. Cushman & Wakefield’s equivalent figure is around 2.3MW.
If we use the Computer Weekly calculations for pipeline, we get capacity growth in excess of 500%. That seems unlikely, with the Cushman & Wakefield numbers looking more realistic. How does such a disparity occur? The Barbour ABI project listings likely include a fair amount of projects for which planning consent has been sought but will never happen.
We’ve also got to take into account that “pipeline” is inherently a little “fuzzy”. Some projects that have consent now won’t be completed for 10 years – the 1GW Elsham Tech Park in the UK, for example – while some projects won’t even make the current pipeline because they’re going to be shorter in duration and have not yet been announced or had plans submitted.
A more accurate measure of pipeline is gained by tracking construction timelines and asking the question about a specific future date for expected completed capacity. That’s possible with UK data from Barbour ABI, for example, but for countries with differing planning regimes and data sources, and developers that tend to keep their cards close to their chests, it is likely to result in a patchy picture.
All this shows the difficulty of assessing current and proposed datacentre capacity. And that’s just domestically. Cushman & Wakefield clearly makes use of its international presence to calculate pipeline and installed capacity worldwide. We can be sure there are many ways in which installed datacentre capacity is recorded and many slips twixt intent and reality in terms of pipeline, but at least we get the lay of the land.
Meanwhile, the UK – with about 1.7GW currently – will reach about 4GW, and looks set to slip in the rankings in terms of absolute datacentre capacity and in terms of megawatts (MW) to gross domestic product (GDP).
That’s according to figures from commercial property agent Cushman & Wakefield, plus GDP data from the International Monetary Fund (IMF), with analysis by Computer Weekly.
Also in the US, Virginia is set to retain its nickname of “datacentre alley”, with capacity in the pipeline that will see it retain its number one region ranking and take it to more than 10GW. London, however, could move up the rankings here to become the sixth largest datacentre region if all planned capacity is built.
The UK currently ranks fourth in megawatt capacity terms – behind the US, China and Japan – with about 1.76GW of capacity. But it will slip to seventh in terms of total operational and planned capacity, with India, Malaysia and Australia set to leapfrog it.
The UK ranks eighth currently in terms of MW to GDP, but will slip to 10th if we measure all current and planned capacity.
In terms of datacentre regional capacity, London ranks eighth with 1.53GW. It stays at eighth if projects under construction are taken into account (rising to 1.82GW), but jumps to sixth if the total pipeline is considered (3.25GW), although that may include projects that have not gained planning consent and may never do so.
It’s possible that “London” takes into account much more than that region in Cushman & Wakefield’s figures, however. Computer Weekly research (see box: Nailing down datacentre pipeline numbers) into installed datacentre capacity has the whole of the UK at about 1.6GW, including the M62 region plus the North East and Scotland.
Ireland currently lies 10th in terms of installed capacity, with 1.27GW. It slides to 13th in terms of total under construction and pipeline, at around 2GW. But in terms of MW to GDP, it sits second, only dropping to third when we measure currently installed and all pipeline against the projected 2030 GDP.
While the US looks determined to maintain its position in the world datacentre rankings – it has a projected capacity growth rate of 221% – it is outstripped in growth terms by some countries that look keen to expand datacentre capacity.
The shooting star among these is Indonesia, with projected growth of 451% in capacity terms (to 2.1GW). Behind it is Malaysia at 279% projected growth (to 4.87GW).
They appear to be aiming at becoming providers of datacentre capacity for regional economies such as Singapore, Thailand and Vietnam.
Singapore had been the dominant regional hub, but power and land constraints saw it call a halt to further datacentre development. This has been somewhat reversed, but Indonesia and Malaysia have seen an opportunity to make use of their resources, with Amazon, Google, Microsoft and Meta pledging billions of dollars towards datacentre projects there.
Meanwhile, the Cushman & Wakefield numbers show growth in datacentre capacity of 200% or more for Australia, India and Brazil.
Australia benefits from vast amounts of land and renewable energy, allied with some of the world’s strictest data sovereignty laws. The latter has forced huge local builds that wouldn’t exist if the data could be hosted in cheaper regional hubs. It is set for datacentre capacity growth of 224% (to 4.8MW) and MW to GDP growth of 149%.
India’s sizeable growth – 222% in capacity (to 5.1MW) and 90% growth in MW to GDP – is driven by regulatory mandates, a gargantuan domestic user base and structural cost advantages. India has implemented some of the world’s most stringent data residency requirements. Also, global companies that previously served India from hubs in Singapore or Dubai are now legally required to build or lease physical capacity inside India.
Brazil benefits from being a key economic centre for South America, is a primary landing point for subsea cables on the continent, has lots of renewable energy and – this is becoming a theme – has strict data sovereignty requirements. It has a projected capacity growth rate of 218% (to 1.6GW) with a MW to GDP growth of 147%.
Here, similarly to India, Brazilian law encourages companies to store the data of Brazilian citizens on-shore, which has forced cloud providers to expand local regions in São Paulo and Rio de Janeiro.
In Europe, meanwhile, the UK, France and Germany are hitting structural limits in terms of power supply, with waits measured in years to get a grid connection. At the same time, there is a scarcity of land and strict sustainability requirements.
Having said that, these are mature markets, and where there are constraints in terms of new construction in established centres, that is now moving towards other areas in nearby countries such as Italy, Spain and Poland, or within countries, such as the shift north in the UK.
Ireland, specifically Dublin, built out its capacity years before the rest of Europe, but was the first major global hub to hit a “grid ceiling”. Current capacity is 1.2GW. Since 2021, state-owned grid operator EirGrid has implemented a functional moratorium on new datacentre connections in the greater Dublin area. By 2024, datacentres consumed 21% of Ireland’s total electricity – more than all its homes combined.
Now, under new regulations, if a company wants to build a new datacentre of more than 10MW, they must provide their own on-site generation – like gas turbines or battery arrays – to back up 100% of their demand.
Meanwhile, Ireland is the European headquarters for virtually every major US tech firm, and because they book profits in Ireland, GDP is roughly 40% higher than the actual value produced by the Irish population. So, its MW to GDP growth rate in these figures is 5.7%.
For that reason, Ireland’s GDP is considered unreliable for measuring actual domestic economic health.
If we measure a country’s datacentre capacity in megawatts (MW) against its gross domestic product (GDP), we get some idea of whether that capacity is primarily a utility supporting its own domestic economy or effectively an export designed to process data for the rest of the world.
By looking at how that will change, we can also see the trajectory of that country relative to its digital economy.
The ratio of MW to GDP is a measure of digital infrastructure compared to the economy more broadly. In the datacentre age, it’s like measuring “miles of track per capita” or “steel production per GDP” as measures of industrial development.
We can see from the numbers that differing models emerge.
Very high ratios of MW capacity to GDP – for example, Ireland, Indonesia, Malaysia – suggest a country positioned as a “digital exporter”. They consume power domestically to process data for other countries. Their MW capacity is high, while GDP is low.
Meanwhile, very low ratios of MW capacity to GDP – for example, Japan, the UK, the Netherlands – will often be mature, service- or manufacturing-heavy economies where datacentres support domestic business rather than act as an export.
Most of the world’s developed economies fall into the latter category, while some rapid movers from a less-developed starting point fall into the former.
Two countries, however, seem set for rapid but balanced growth – the US and Australia. They’re both countries with vast space and scope for renewable energy, and they have developed economies. With projected MW to GDP growth of 150% or more, that could indicate a sweet spot in terms of economic development.
We must treat a lot of the numbers around datacentre development with some dosage of salt. Computer Weekly recently ran analyses of installed and pipeline capacity for the UK. In some cases, those figures accord with Cushman & Wakefield’s research.
For currently installed UK capacity, Computer Weekly calculated 1.6GW using data gained from Electricity Performance Certificate registers. Cushman & Wakefield posts a total 1.7GW.
When it comes to pipeline, Computer Weekly took data from construction tracking analyst Barbour ABI that lists all projects currently in planning, some of which have gained consent, while others have not. Within this data, some megawatt capacity numbers had to be estimated because planning documents don’t mandate recording of proposed datacentre capacity.
Computer Weekly calculations for the UK pipeline total around 8GW, with 5.9GW having planning consent or being under construction. Cushman & Wakefield’s equivalent figure is around 2.3MW.
If we use the Computer Weekly calculations for pipeline, we get capacity growth in excess of 500%. That seems unlikely, with the Cushman & Wakefield numbers looking more realistic. How does such a disparity occur? The Barbour ABI project listings likely include a fair amount of projects for which planning consent has been sought but will never happen.
We’ve also got to take into account that “pipeline” is inherently a little “fuzzy”. Some projects that have consent now won’t be completed for 10 years – the 1GW Elsham Tech Park in the UK, for example – while some projects won’t even make the current pipeline because they’re going to be shorter in duration and have not yet been announced or had plans submitted.
A more accurate measure of pipeline is gained by tracking construction timelines and asking the question about a specific future date for expected completed capacity. That’s possible with UK data from Barbour ABI, for example, but for countries with differing planning regimes and data sources, and developers that tend to keep their cards close to their chests, it is likely to result in a patchy picture.
All this shows the difficulty of assessing current and proposed datacentre capacity. And that’s just domestically. Cushman & Wakefield clearly makes use of its international presence to calculate pipeline and installed capacity worldwide. We can be sure there are many ways in which installed datacentre capacity is recorded and many slips twixt intent and reality in terms of pipeline, but at least we get the lay of the land.

 ComputerWeekly
It looks like we’re heading for a new American Century when it comes to datacentre development, with US capacity set to triple to a staggering 102GW if all projected capacity in the pipeline comes to fruition.
Meanwhile, the UK – with about 1.7GW currently – will reach about 4GW, and looks set to slip in the rankings in terms of absolute datacentre capacity and in terms of megawatts (MW) to gross domestic product (GDP).
That’s according to figures from commercial property agent Cushman & Wakefield, plus GDP data from the International Monetary Fund (IMF), with analysis by Computer Weekly.
Also in the US, Virginia is set to retain its nickname of “datacentre alley”, with capacity in the pipeline that will see it retain its number one region ranking and take it to more than 10GW. London, however, could move up the rankings here to become the sixth largest datacentre region if all planned capacity is built.
The UK currently ranks fourth in megawatt capacity terms – behind the US, China and Japan – with about 1.76GW of capacity. But it will slip to seventh in terms of total operational and planned capacity, with India, Malaysia and Australia set to leapfrog it.
The UK ranks eighth currently in terms of MW to GDP, but will slip to 10th if we measure all current and planned capacity.
In terms of datacentre regional capacity, London ranks eighth with 1.53GW. It stays at eighth if projects under construction are taken into account (rising to 1.82GW), but jumps to sixth if the total pipeline is considered (3.25GW), although that may include projects that have not gained planning consent and may never do so.
It’s possible that “London” takes into account much more than that region in Cushman & Wakefield’s figures, however. Computer Weekly research (see box: Nailing down datacentre pipeline numbers) into installed datacentre capacity has the whole of the UK at about 1.6GW, including the M62 region plus the North East and Scotland.
Ireland currently lies 10th in terms of installed capacity, with 1.27GW. It slides to 13th in terms of total under construction and pipeline, at around 2GW. But in terms of MW to GDP, it sits second, only dropping to third when we measure currently installed and all pipeline against the projected 2030 GDP.
While the US looks determined to maintain its position in the world datacentre rankings – it has a projected capacity growth rate of 221% – it is outstripped in growth terms by some countries that look keen to expand datacentre capacity.
The shooting star among these is Indonesia, with projected growth of 451% in capacity terms (to 2.1GW). Behind it is Malaysia at 279% projected growth (to 4.87GW).
They appear to be aiming at becoming providers of datacentre capacity for regional economies such as Singapore, Thailand and Vietnam.
Singapore had been the dominant regional hub, but power and land constraints saw it call a halt to further datacentre development. This has been somewhat reversed, but Indonesia and Malaysia have seen an opportunity to make use of their resources, with Amazon, Google, Microsoft and Meta pledging billions of dollars towards datacentre projects there.
Meanwhile, the Cushman & Wakefield numbers show growth in datacentre capacity of 200% or more for Australia, India and Brazil.
Australia benefits from vast amounts of land and renewable energy, allied with some of the world’s strictest data sovereignty laws. The latter has forced huge local builds that wouldn’t exist if the data could be hosted in cheaper regional hubs. It is set for datacentre capacity growth of 224% (to 4.8MW) and MW to GDP growth of 149%.
India’s sizeable growth – 222% in capacity (to 5.1MW) and 90% growth in MW to GDP – is driven by regulatory mandates, a gargantuan domestic user base and structural cost advantages. India has implemented some of the world’s most stringent data residency requirements. Also, global companies that previously served India from hubs in Singapore or Dubai are now legally required to build or lease physical capacity inside India.
Brazil benefits from being a key economic centre for South America, is a primary landing point for subsea cables on the continent, has lots of renewable energy and – this is becoming a theme – has strict data sovereignty requirements. It has a projected capacity growth rate of 218% (to 1.6GW) with a MW to GDP growth of 147%.
Here, similarly to India, Brazilian law encourages companies to store the data of Brazilian citizens on-shore, which has forced cloud providers to expand local regions in São Paulo and Rio de Janeiro.
In Europe, meanwhile, the UK, France and Germany are hitting structural limits in terms of power supply, with waits measured in years to get a grid connection. At the same time, there is a scarcity of land and strict sustainability requirements.
Having said that, these are mature markets, and where there are constraints in terms of new construction in established centres, that is now moving towards other areas in nearby countries such as Italy, Spain and Poland, or within countries, such as the shift north in the UK.
Ireland, specifically Dublin, built out its capacity years before the rest of Europe, but was the first major global hub to hit a “grid ceiling”. Current capacity is 1.2GW. Since 2021, state-owned grid operator EirGrid has implemented a functional moratorium on new datacentre connections in the greater Dublin area. By 2024, datacentres consumed 21% of Ireland’s total electricity – more than all its homes combined.
Now, under new regulations, if a company wants to build a new datacentre of more than 10MW, they must provide their own on-site generation – like gas turbines or battery arrays – to back up 100% of their demand.
Meanwhile, Ireland is the European headquarters for virtually every major US tech firm, and because they book profits in Ireland, GDP is roughly 40% higher than the actual value produced by the Irish population. So, its MW to GDP growth rate in these figures is 5.7%.
For that reason, Ireland’s GDP is considered unreliable for measuring actual domestic economic health.
If we measure a country’s datacentre capacity in megawatts (MW) against its gross domestic product (GDP), we get some idea of whether that capacity is primarily a utility supporting its own domestic economy or effectively an export designed to process data for the rest of the world.
By looking at how that will change, we can also see the trajectory of that country relative to its digital economy.
The ratio of MW to GDP is a measure of digital infrastructure compared to the economy more broadly. In the datacentre age, it’s like measuring “miles of track per capita” or “steel production per GDP” as measures of industrial development.
We can see from the numbers that differing models emerge.
Very high ratios of MW capacity to GDP – for example, Ireland, Indonesia, Malaysia – suggest a country positioned as a “digital exporter”. They consume power domestically to process data for other countries. Their MW capacity is high, while GDP is low.
Meanwhile, very low ratios of MW capacity to GDP – for example, Japan, the UK, the Netherlands – will often be mature, service- or manufacturing-heavy economies where datacentres support domestic business rather than act as an export.
Most of the world’s developed economies fall into the latter category, while some rapid movers from a less-developed starting point fall into the former.
Two countries, however, seem set for rapid but balanced growth – the US and Australia. They’re both countries with vast space and scope for renewable energy, and they have developed economies. With projected MW to GDP growth of 150% or more, that could indicate a sweet spot in terms of economic development.
We must treat a lot of the numbers around datacentre development with some dosage of salt. Computer Weekly recently ran analyses of installed and pipeline capacity for the UK. In some cases, those figures accord with Cushman & Wakefield’s research.
For currently installed UK capacity, Computer Weekly calculated 1.6GW using data gained from Electricity Performance Certificate registers. Cushman & Wakefield posts a total 1.7GW.
When it comes to pipeline, Computer Weekly took data from construction tracking analyst Barbour ABI that lists all projects currently in planning, some of which have gained consent, while others have not. Within this data, some megawatt capacity numbers had to be estimated because planning documents don’t mandate recording of proposed datacentre capacity.
Computer Weekly calculations for the UK pipeline total around 8GW, with 5.9GW having planning consent or being under construction. Cushman & Wakefield’s equivalent figure is around 2.3MW.
If we use the Computer Weekly calculations for pipeline, we get capacity growth in excess of 500%. That seems unlikely, with the Cushman & Wakefield numbers looking more realistic. How does such a disparity occur? The Barbour ABI project listings likely include a fair amount of projects for which planning consent has been sought but will never happen.
We’ve also got to take into account that “pipeline” is inherently a little “fuzzy”. Some projects that have consent now won’t be completed for 10 years – the 1GW Elsham Tech Park in the UK, for example – while some projects won’t even make the current pipeline because they’re going to be shorter in duration and have not yet been announced or had plans submitted.
A more accurate measure of pipeline is gained by tracking construction timelines and asking the question about a specific future date for expected completed capacity. That’s possible with UK data from Barbour ABI, for example, but for countries with differing planning regimes and data sources, and developers that tend to keep their cards close to their chests, it is likely to result in a patchy picture.
All this shows the difficulty of assessing current and proposed datacentre capacity. And that’s just domestically. Cushman & Wakefield clearly makes use of its international presence to calculate pipeline and installed capacity worldwide. We can be sure there are many ways in which installed datacentre capacity is recorded and many slips twixt intent and reality in terms of pipeline, but at least we get the lay of the land.